ResearchSaturday, February 28, 2026

AI-Powered Solar O&M Intelligence: The $2B Opportunity in India's Fragmented Renewable Maintenance Market

India installed 100+ GW of solar capacity but has no unified intelligence layer for operations and maintenance. With 42.5 GW being added in 2026 alone, the gap between installed capacity and maintenance capability creates a massive opportunity for AI-driven O&M platforms that aggregate fragmented providers, enable predictive maintenance, and orchestrate robotic cleaning fleets.

1.

Executive Summary

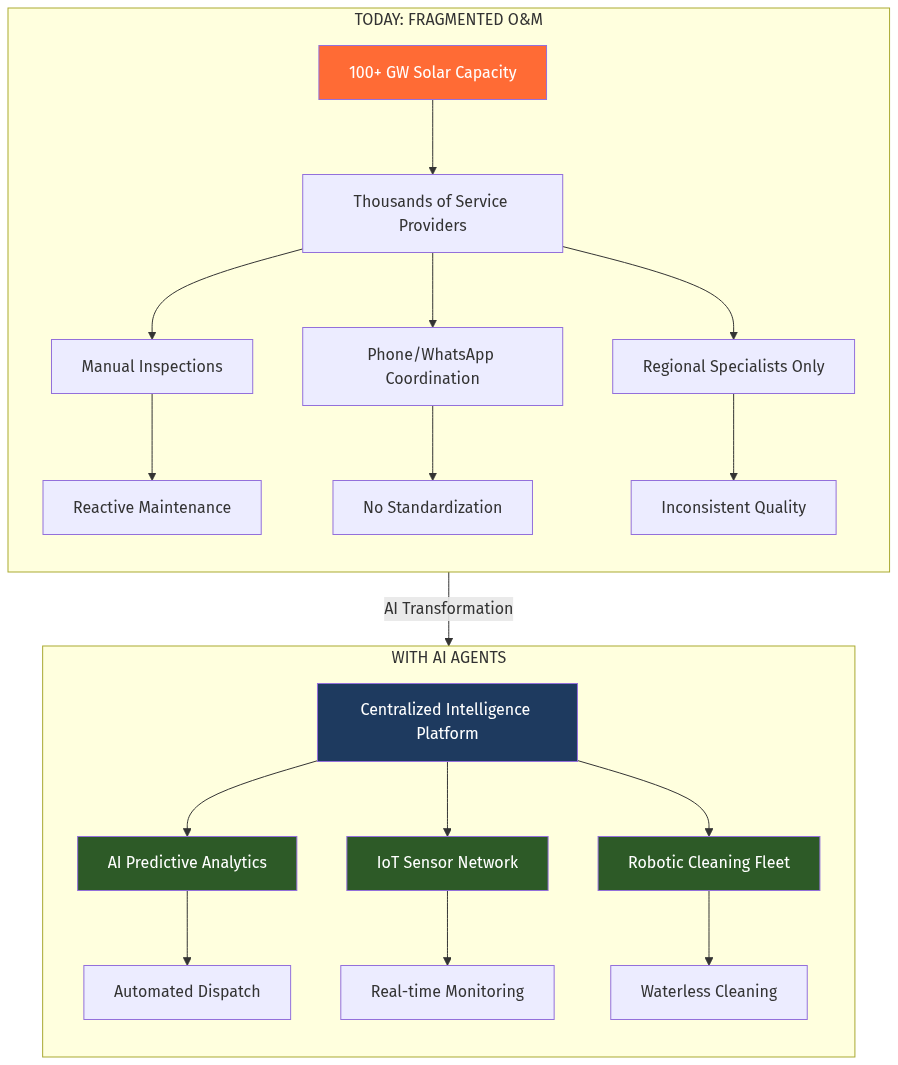
India's solar sector has achieved remarkable scale—100+ GW installed capacity with 42.5 GW projected additions in 2026. But operations and maintenance (O&M) remains fragmented across thousands of regional providers using manual processes, reactive maintenance, and phone/WhatsApp coordination.

Applying Zeroth Principles: Before assuming "more solar needs more O&M," we question the fundamental axiom: Why does solar O&M exist as a separate market at all? The answer reveals the opportunity—panels degrade 0.5-1% annually, soiling causes 15-25% energy loss in dusty regions, and inverter failures account for 75% of downtime. O&M isn't optional; it's the difference between 8% and 15% IRR for asset owners.

The market is ripe for an AI-native platform that:

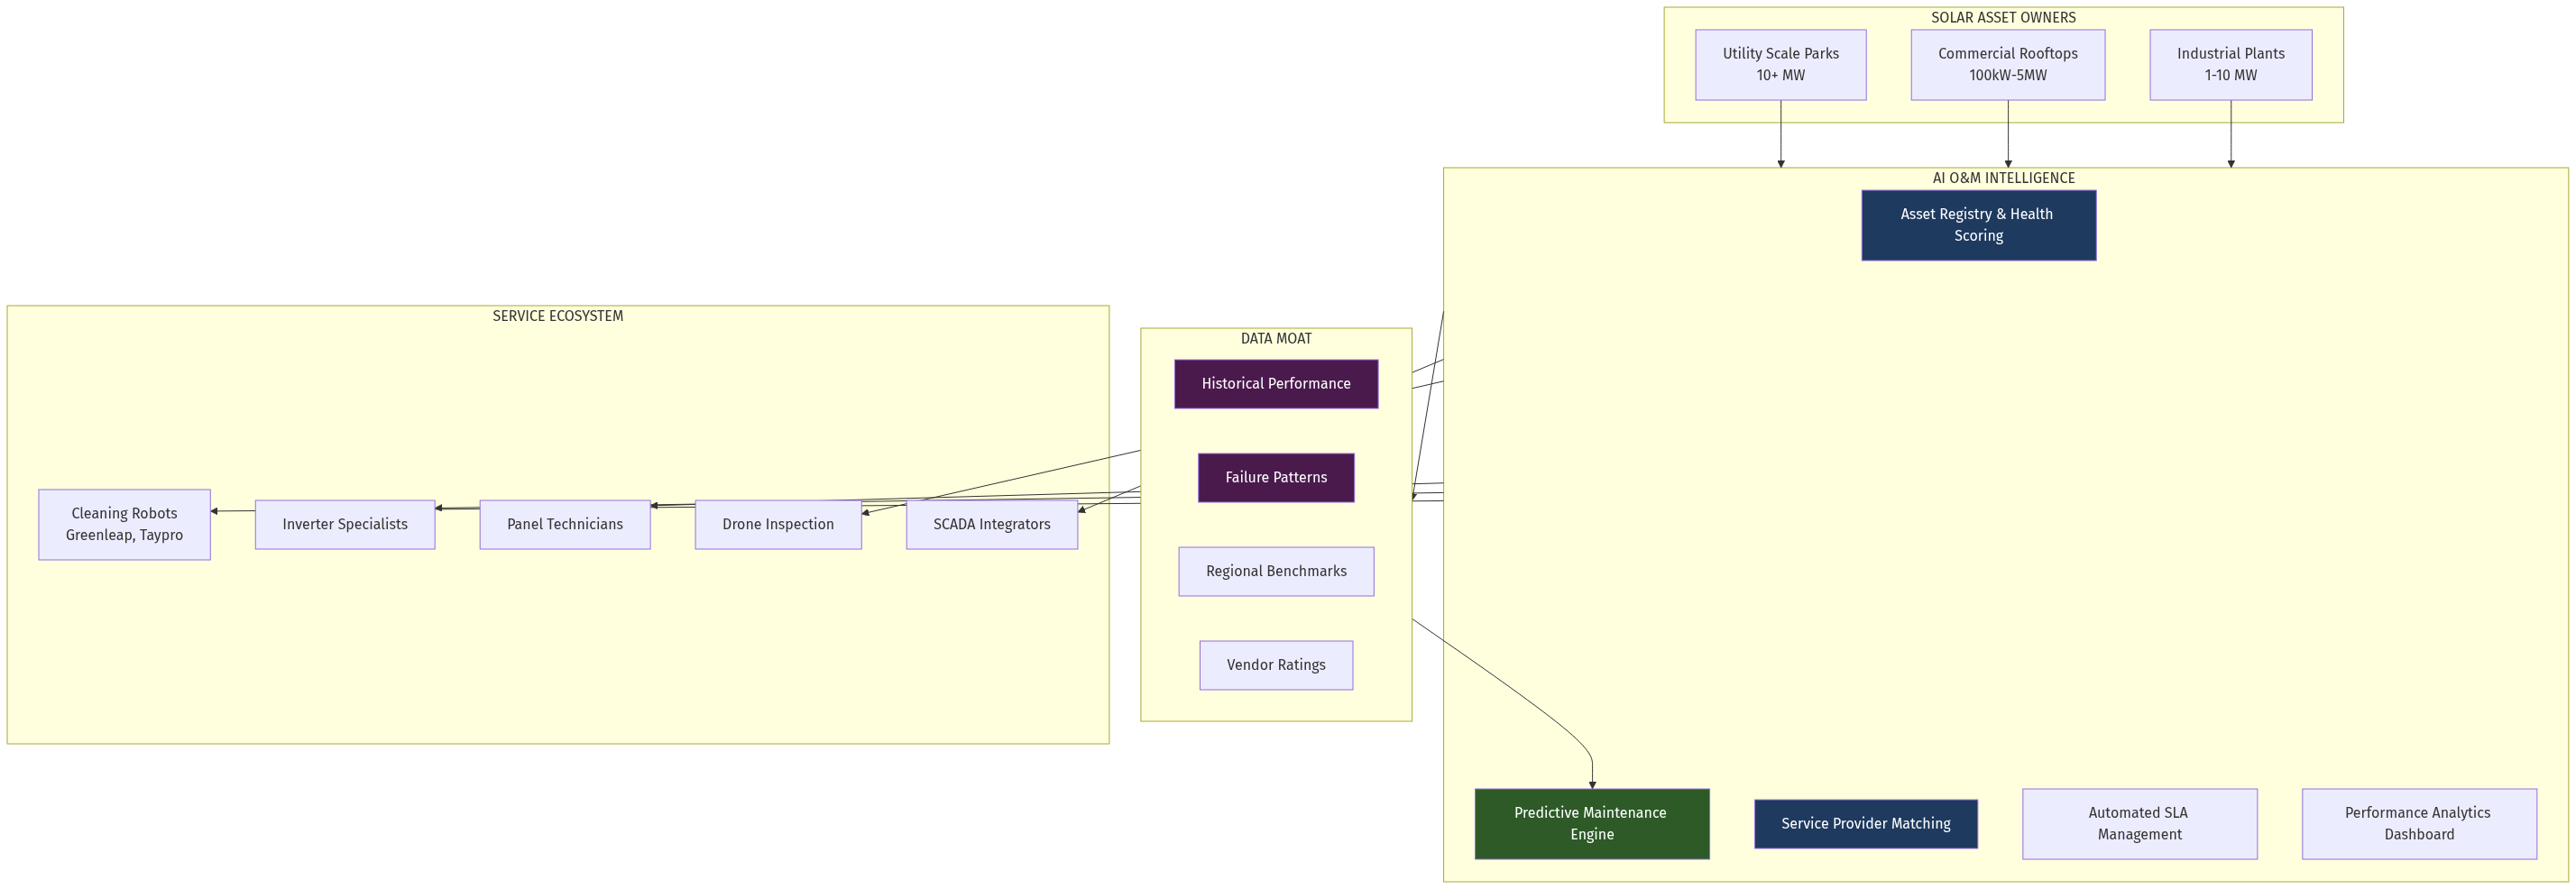
  • Aggregates fragmented O&M providers into a unified marketplace
  • Deploys predictive maintenance using IoT sensor data and ML models
  • Orchestrates robotic cleaning fleets across regions
  • Creates the first pan-India solar health scoring and benchmarking system
---

2.

Problem Statement

Who experiences this pain?
StakeholderCore Pain Point
Solar Asset OwnersNo visibility into actual performance vs potential; reactive maintenance causes revenue loss
O&M Service ProvidersFragmented demand, no scale economies, manual operations
Investors/IPPsAsset performance varies wildly; no standardized health metrics
Grid OperatorsUnreliable forecasting from poorly maintained plants
Incentive Mapping (Mental Model): The current system persists because:
  • EPC companies profit from bundled O&M contracts that prioritize warranty compliance over performance optimization
  • Regional providers lack incentive to share data that would enable benchmarking
  • Asset owners often lack technical expertise to evaluate O&M quality
  • No one gets penalized for underperformance below contract SLAs
The hidden tax: A 100 MW solar park losing 5% generation to suboptimal O&M loses ₹15-20 crore annually. Across India's 100+ GW capacity, poor O&M represents ₹15,000-20,000 crore in annual lost revenue.
3.

Current Solutions

CompanyWhat They DoWhy They're Not Solving It
Tata Power SolarEnd-to-end EPC with bundled O&MClosed ecosystem; no marketplace model
Vikram SolarO&M for own installations (1.03 GW)Tied to hardware sales; limited to own projects
Mahindra SustenAsset management for 1.65 GWp+Enterprise-only; no SMB/rooftop play
Greenleap RoboticsAutonomous cleaning robots with SCADA integrationHardware-focused; not a marketplace
TayproAI/ML-powered cleaning robotsVertical product; limited service orchestration
Airtouch SolarWaterless cleaning robotsOEM model; not aggregating services
Distant Domain Import (Mental Model): Looking at unrelated industries that solved similar fragmentation:
  • Healthcare diagnostics (SRL/Thyrocare model): Aggregated fragmented pathology labs into a unified collection + testing network with standardized quality
  • Logistics (Delhivery/Rivigo): Unified fragmented trucking with a tech layer for visibility and optimization
  • Building maintenance (UrbanClap/now Urban Company): Aggregated electricians, plumbers into a rated, bookable marketplace
  • The solar O&M opportunity mirrors Urban Company for industrial solar—but with IoT, predictive AI, and robotic cleaning as core differentiators.


    4.

    Market Opportunity

    • India Solar O&M Market: ~$1.5-2 billion annually (estimated at 2-3% of asset value for 100+ GW)
    • Global Solar O&M Market: $8.2 billion (2024) → $17.5 billion (2030), CAGR 13.4%
    • Predictive Monitoring Segment: $965M (2026) → $1.97B (2036), CAGR 7.4%
    • Robotic Cleaning Segment: Growing at 15%+ CAGR in India
    Why Now:
  • Scale reached critical mass: 100+ GW installed means O&M is now a standalone market, not an afterthought
  • AI/IoT costs collapsed: Edge sensors, cloud analytics, and ML models are 10x cheaper than 5 years ago
  • Labor shortage intensifying: Skilled solar technicians are scarce; automation is no longer optional
  • Performance pressure: As solar becomes the cheapest energy source, maximizing yield becomes competitive advantage
  • Data standardization emerging: SCADA protocols and smart inverters create interoperable data layers
  • Market Transformation
    Market Transformation

    5.

    Gaps in the Market

    Anomaly Hunting (Mental Model): What's strange about this market?
    • Gap 1: No unified health scoring. Unlike vehicles (with OBD diagnostics) or buildings (with BMS), solar plants have no standardized health metric. Each O&M provider uses different KPIs.
    • Gap 2: Cleaning is still mostly manual. Despite robotic solutions existing, 90%+ of India's solar capacity is cleaned manually with water—in a water-scarce country.
    • Gap 3: No marketplace for O&M services. Asset owners negotiate bilaterally with providers; no price transparency or quality benchmarking exists.
    • Gap 4: Predictive maintenance is rare. Most plants run reactive or preventive schedules; true predictive (failure prediction) is only at <5% of installations.
    • Gap 5: Data silos everywhere. Each EPC/O&M provider hoards performance data; no industry benchmarking or best practice sharing.
    Second-Order Thinking: If these gaps persist:
    • Asset owners will continue losing 10-20% of potential generation
    • Insurance/financing will remain expensive due to performance uncertainty
    • India's 500 GW renewable target by 2030 will face operational bottlenecks

    6.

    AI Disruption Angle

    How AI agents transform this workflow:
    Current ProcessAI-Enabled Future
    Manual site inspections (monthly)Continuous IoT monitoring with anomaly alerts
    Phone calls to schedule cleaningAI agent dispatches nearest robot/crew automatically
    Excel-based performance trackingReal-time dashboard with predictive degradation curves
    Reactive fault response (days)Predictive alerts + pre-positioned parts (hours)
    Bilateral price negotiationAlgorithmic pricing based on site complexity and vendor ratings
    Counterfactual Analysis (Mental Model): What if we removed the human dispatcher entirely?

    An AI agent could:

  • Ingest SCADA/inverter data continuously
  • Predict cleaning needs based on soiling models + weather data
  • Dispatch the nearest available cleaning robot or crew
  • Verify completion via before/after generation data
  • Handle payment and update vendor ratings automatically
  • This removes 80% of coordination overhead and enables a single operations center to manage 10 GW+ of distributed assets.


    7.

    Product Concept

    Platform Architecture:
    Platform Architecture
    Platform Architecture
    Core Modules:
  • Asset Registry & Health Scoring
  • - Unified dashboard for all solar assets (rooftop to utility) - Standardized health score (0-100) based on PR, availability, degradation - Benchmarking against regional and national averages
  • Predictive Maintenance Engine
  • - ML models for inverter failure prediction (75% of failures) - Soiling loss estimation using satellite imagery + weather data - Optimal cleaning schedule generation
  • Service Provider Marketplace
  • - Onboarded and rated O&M providers by region and specialty - Robotic cleaning fleet integration (Greenleap, Taypro, Airtouch APIs) - Transparent pricing with automated SLA tracking
  • AI Operations Agent
  • - WhatsApp/voice interface for asset owners - Natural language queries: "How is my Rajasthan plant performing?" - Automated dispatch: "Schedule cleaning if PR drops below 80%"
  • Financial Analytics
  • - Revenue loss quantification from suboptimal O&M - ROI calculator for maintenance investments - Insurance/financing integration for performance-linked products
    8.

    Development Plan

    PhaseTimelineDeliverables
    MVP12 weeksAsset registry + health scoring for 50 pilot plants; basic provider marketplace
    V124 weeksPredictive maintenance engine; robotic cleaning integration; WhatsApp bot
    V240 weeksFull AI operations agent; financial analytics; pan-India provider network
    Scale52 weeksAPI platform for EPCs/investors; insurance partnerships; 5 GW under management
    Technical Stack:
    • Data Ingestion: MQTT/Modbus from SCADA, inverter APIs (Huawei, SMA, Sungrow)
    • ML Platform: Time-series forecasting (Prophet/NeuralProphet) + anomaly detection
    • Marketplace: Node.js backend, React dashboard, WhatsApp Business API
    • Robotics Integration: APIs to Greenleap/Taypro; custom dispatch orchestration

    9.

    Go-To-Market Strategy

    Falsification (Pre-Mortem): Assume 5 well-funded startups failed in solar O&M. Why?
  • Tried to sell to utilities first → 18-month sales cycles killed them
  • Built hardware (robots) without marketplace → Capital-intensive, hard to scale
  • Ignored the "Jugaad" economy → Existing relationships matter; can't just be better tech
  • Underestimated regional complexity → Rajasthan dust ≠ Kerala monsoon ≠ Gujarat coastal
  • No data moat → Easy for incumbents to copy features
  • GTM to avoid these failures:
  • Start with commercial/industrial rooftops (1-5 MW)
  • - Faster sales cycles (CFO-level decisions) - High pain (no in-house O&M teams) - Willing to pay for performance guarantees
  • Partner with robotic cleaning OEMs
  • - Don't build hardware; aggregate existing fleets - Offer them demand; they offer capacity
  • Acquire data through free tier
  • - Free asset monitoring for first 100 plants - Build the health scoring benchmark with real data - Monetize through premium features + provider referrals
  • Geographic wedge: Rajasthan → Gujarat → AP/Telangana
  • - Highest soiling losses = highest willingness to pay - Build regional provider networks sequentially
  • Integration partnerships
  • - Partner with SMA/Huawei/Sungrow for inverter data access - White-label for large EPCs who want O&M intelligence
    10.

    Revenue Model

    Revenue StreamModelPotential
    SaaS Monitoring₹5,000-50,000/MW/monthCore recurring revenue
    Marketplace Commission10-15% of service transactionsScales with GMV
    Performance GuaranteesRevenue share on incremental generationPremium tier
    Data/Benchmarking Reports₹1-5 lakh per reportFor investors, insurers
    API AccessUsage-based pricingFor EPCs, integrators
    Unit Economics Target:
    • CAC: ₹50,000 per MW acquired
    • LTV: ₹6 lakh per MW (5-year contract @ ₹10K/MW/month)
    • LTV:CAC: 12x

    11.

    Data Moat Potential

    Steelmanning (Mental Model): Why might incumbents win?
    • Tata/Adani have existing relationships with 80%+ of utility-scale projects
    • EPC providers can bundle O&M at near-zero marginal cost
    • Regional players know local conditions better than any platform
    Counter-argument (why data moat wins):
  • Cross-plant learning: An independent platform sees performance across vendors, regions, and equipment types. No single EPC has this view.
  • Vendor rating system: First platform to rate O&M providers creates switching costs; asset owners won't leave a platform where they trust the ratings.
  • Predictive models improve with scale: Failure prediction at 5 GW is vastly better than at 500 MW.
  • Benchmark becomes industry standard: If your health score becomes how insurers/investors evaluate assets, you become infrastructure.
  • Proprietary data that accumulates:
    • Inverter failure patterns by brand, region, age
    • Soiling coefficients by geography and season
    • Cleaning effectiveness by method (robot vs manual, wet vs dry)
    • Vendor performance and reliability scores
    • True degradation rates vs manufacturer claims

    12.

    Why This Fits AIM Ecosystem

    Strategic Alignment:
  • Industrial B2B marketplace DNA: Solar O&M is classic "fragmented services + structured demand" — AIM's core thesis
  • AI-native from day one: Predictive maintenance, robotic orchestration, and health scoring are impossible without ML
  • Domain portfolio synergy: solarom.in, solarom.ai, om.solar — potential acquisitions
  • Data compounds across verticals: Learnings from solar O&M intelligence apply to wind, EV charging, industrial equipment
  • India-to-global path: India is the world's fastest-growing solar market; platform built here can expand to Middle East, SEA, Africa
  • Cross-sell opportunities:
    • Solar equipment procurement (panels, inverters) through AIM marketplace
    • Financing/insurance products for asset owners
    • Carbon credit tracking and trading

    ## Verdict

    Opportunity Score: 8.5/10
    CriterionScoreRationale
    Market Size9/10$2B+ in India alone; global expansion path
    Fragmentation9/10Thousands of providers, no dominant platform
    AI Disruption Fit9/10Predictive maintenance + robotics = massive efficiency gains
    Timing8/10Scale reached critical mass; AI costs collapsed
    Execution Risk7/10Requires EPC partnerships; regional complexity
    Data Moat9/10Cross-plant learning creates defensibility
    AIM Fit8/10Classic industrial marketplace with AI layer
    Bayesian Confidence Update:
    • Prior: 50% (generic "fragmented market" opportunity)
    • Evidence: 100+ GW scale, robotic solutions exist but not aggregated, no platform player
    • Posterior: 80% confidence this is a real, fundable, executable opportunity
    Recommendation: High-priority opportunity for AIM ecosystem. Start with commercial/industrial rooftops, build the health scoring benchmark, and partner with robotic OEMs rather than building hardware.

    ## Sources