ResearchWednesday, February 25, 2026

AI-Powered Medical Equipment Service Intelligence: Breaking the OEM Lock-In

The $50 billion medical equipment service market is one of healthcare's most opaque and fragmented sectors. Hospitals overpay by 40-70% for maintenance because they lack visibility into alternatives. AI agents can finally crack this market open.

1.

Executive Summary

Medical equipment service is a paradox: a $50+ billion global market dominated by OEMs charging premium prices, while thousands of Independent Service Organizations (ISOs) offer comparable quality at 30-50% lower cost. Yet hospitals continue paying OEM rates because finding, vetting, and managing alternatives is prohibitively difficult.

This isn't a technology gap—it's an information gap. AI agents can bridge it by creating a structured marketplace that matches healthcare facilities with the right service providers based on equipment type, location, urgency, and price sensitivity.

The opportunity: Build the "Angi for medical equipment"—but smarter, with AI-powered matching, predictive maintenance alerts, and transparent pricing that finally breaks the OEM stranglehold.
2.

Problem Statement

Who Experiences This Pain?

Hospital Administrators & Facilities Managers spend 15-20% of their equipment budget on service contracts. For a mid-sized hospital with $50M in imaging equipment, that's $7-10M annually—often locked into OEM contracts that auto-renew without competitive bidding. Biomedical Engineering Directors know alternatives exist but lack time to vet ISOs, verify parts quality, and manage multiple vendors. The path of least resistance is the OEM. Independent Service Organizations have the skills but struggle to reach buyers. They rely on word-of-mouth, cold calls, and trade shows—all inefficient channels for a trust-intensive sale.

The Core Dysfunction

Current Medical Equipment Service Market

When a CT scanner fails at 2 AM, the hospital calls the OEM because:

  • They don't know which ISOs serve their area
  • They can't verify ISO credentials quickly
  • They have no visibility into parts availability
  • Response time is unpredictable with unknowns
  • This creates a vicious cycle: OEMs charge premium prices because they can, ISOs remain fragmented, and hospitals keep overpaying.


    3.

    Current Solutions

    CompanyWhat They DoWhy They're Not Solving It
    PartsSourceParts procurement marketplaceParts only, not service matching
    TechNationISO trade association + directoryPassive listing, no AI matching
    AAMI BioMedCertification & trainingStandards body, not marketplace
    Cassling/TriMedxLarge ISOs with regional coverageSingle provider, not marketplace
    MedWrenchEquipment community + partsForum model, not transactional

    The Missing Layer

    No platform currently offers:

    • Real-time service provider matching by equipment type + location
    • Transparent, comparable pricing
    • Verified credentials and performance ratings
    • Predictive maintenance alerts integrated with service booking
    • AI-powered triage to route issues to the right provider tier
    ---

    4.

    Market Opportunity

    Market Size

    • Global medical equipment service market: $54.2 billion (2025)
    • US market: $18.7 billion
    • India market: $2.1 billion
    • CAGR: 7.3% through 2030

    Addressable Segments

    SegmentSizeISO PenetrationOpportunity
    Imaging (CT, MRI, X-Ray)$22B25%High-value, complex
    Patient Monitoring$8B40%Volume opportunity
    Surgical Equipment$7B15%Emerging ISO market
    Lab Equipment$6B45%Fragmented suppliers

    Why Now?

  • Right to Repair momentum: Legislative pressure forcing OEMs to share service documentation
  • Hospital cost pressure: Post-pandemic margins squeezed; CFOs actively seeking savings
  • ISO professionalization: Quality standards improving; certification paths established
  • AI capability: LLMs can finally parse service histories, manuals, and match providers intelligently

  • 5.

    Gaps in the Market

    Applying ANOMALY HUNTING

    Anomaly 1: The 40% Price Gap ISOs charge 30-50% less than OEMs for equivalent service. In any other market, this gap would drive massive buyer migration. In medical equipment, it persists. Why? Root cause: Information asymmetry + risk aversion. Biomedical directors fear blame if an ISO service fails. OEM contracts provide cover. Anomaly 2: No Aggregator Exists HomeAdvisor aggregated home services. Zocdoc aggregated healthcare appointments. Expedia aggregated travel. Nobody has aggregated medical equipment service—a $50B market. Root cause: Equipment complexity creates perceived barriers. But AI can now handle the complexity. Anomaly 3: ISOs Don't Market Most successful ISOs grow purely through referrals. They have no sales teams, no digital presence, no marketing. They're leaving money on the table. Root cause: Technical founders, not business builders. Classic gap for a marketplace to fill.

    Structural Gaps

  • No standardized pricing: Each quote is custom, making comparison impossible
  • No performance data: No hospital knows if their OEM contract outperforms alternatives
  • No predictive layer: Service is reactive, not proactive
  • No parts visibility: Hospitals can't see which ISOs have parts in stock

  • 6.

    AI Disruption Angle

    Mental Model: DISTANT DOMAIN IMPORT

    What field solved this? Auto repair.

    The automotive aftermarket faced identical dynamics: manufacturer-controlled service, independent shops with credibility gaps, consumers defaulting to dealers. Solutions emerged:

    • RepairPal: Transparent pricing + shop ratings
    • Openbay: Competitive bidding for repairs
    • YourMechanic: Mobile service + standardized pricing
    Import the pattern: Medical equipment needs RepairPal + Openbay hybrid:
    • Standardized service categories with price benchmarks
    • Verified provider credentials (like RepairPal's certification)
    • Competitive quote collection (like Openbay's RFQ flow)

    How AI Agents Transform the Workflow

    AI-Powered Medical Equipment Service Intelligence
    AI-Powered Medical Equipment Service Intelligence
    Current Flow (Manual):
  • Equipment fails → 2. Biomed team diagnoses → 3. Calls OEM or known ISO → 4. Waits for quote → 5. Schedules service → 6. Service performed → 7. Pays invoice
  • AI-Enabled Flow:
  • Equipment alerts AI agent (IoT integration) OR biomed describes issue
  • AI agent identifies equipment, pulls service history, predicts likely cause
  • Agent queries provider network: who's available, what's the price, do they have parts?
  • Presents ranked options with transparent pricing to biomed
  • Biomed selects; agent schedules, confirms, tracks
  • Post-service: AI captures feedback, updates provider ratings
  • Time saved: 4-6 hours per service event Cost saved: 30-40% through competitive visibility
    7.

    Product Concept

    Core Platform: MedService.ai

    For Healthcare Facilities:
    • Equipment registry (import from CMMS or manual entry)
    • Service request workflow (describe issue → get matched quotes)
    • Contract management (track renewals, compare pricing)
    • Predictive maintenance alerts (based on equipment age, usage patterns, industry data)
    • Performance dashboard (compare your costs to benchmarks)
    For Service Providers (ISOs, Biomeds):
    • Profile with credentials, certifications, coverage areas
    • Equipment specialization tags
    • Parts inventory integration
    • Quote management + scheduling
    • Performance scoring (response time, first-time-fix rate, ratings)

    AI Agent Capabilities

  • Intake Agent: Natural language description → structured service ticket
  • Matching Agent: Equipment + issue + location → ranked provider list
  • Quote Agent: Standardizes quotes for apples-to-apples comparison
  • Scheduling Agent: Coordinates availability across parties
  • Knowledge Agent: Answers "Is this normal?" questions from service history patterns
  • Market Structure

    Medical Equipment Service Market Structure
    Medical Equipment Service Market Structure

    8.

    Development Plan

    PhaseTimelineDeliverables
    MVP12 weeksEquipment registry, service request workflow, manual provider matching (3 metro areas)
    V1+8 weeksAI-powered matching, provider profiles, quote comparison, ratings
    V2+12 weeksPredictive maintenance, CMMS integrations, parts inventory visibility
    V3+16 weeksContract management, benchmarking, nationwide coverage

    Technical Stack

    • Frontend: Next.js + mobile-responsive PWA
    • Backend: FastAPI + PostgreSQL
    • AI: Claude/GPT-4 for intake + matching, custom ML for predictions
    • Integrations: HL7 FHIR for healthcare systems, common CMMS APIs

    9.

    Go-To-Market Strategy

    Phase 1: Imaging Equipment in 3 Metros (Months 1-6)

    Why imaging? Highest ticket size ($5K-50K per service), clear ISO alternatives, most urgent pain. Why 3 metros? Density enables provider network depth (target: 10+ ISOs per market). Target cities: Houston, Atlanta, Chicago (large healthcare markets, strong ISO presence) Acquisition:
  • Partner with 2-3 regional ISOs per market (they become founding providers)
  • Direct outreach to hospital biomedical directors (LinkedIn, trade associations)
  • Content: "What Your OEM Contract Really Costs" comparison reports
  • Phase 2: Category Expansion (Months 7-12)

    Add patient monitoring, surgical, lab equipment. Expand to 10 metros.

    Phase 3: Predictive Layer (Year 2)

    IoT integrations with equipment manufacturers. Shift from reactive to proactive service.


    10.

    Revenue Model

    Transaction Fees

    • Per-service fee: 8-12% of service invoice (paid by provider)
    • Subscription (providers): $199-499/month for premium placement + lead priority

    SaaS Layer (Facilities)

    • Free: Basic equipment registry, 3 service requests/month
    • Pro ($299/mo): Unlimited requests, benchmarking, contract alerts
    • Enterprise ($999/mo): CMMS integration, predictive maintenance, dedicated support

    Premium Services

    • RFP management: Run competitive bids for annual contracts (flat fee per RFP)
    • Parts procurement: Commission on parts sourced through platform

    Unit Economics Target

    • Average service ticket: $3,500
    • Platform take rate: 10% = $350
    • Target facilities: 2,000 active (Year 3)
    • Services/facility/year: 24
    • Revenue potential: $16.8M ARR from transactions alone

    11.

    Data Moat Potential

    What Accumulates Over Time

  • Service histories by equipment model: Nobody has this at scale. Enables predictive maintenance models.
  • Provider performance data: Response times, first-time-fix rates, pricing by service type. Becomes the Yelp for medical equipment service.
  • Pricing intelligence: First platform to know actual market rates for "CT scanner tube replacement" or "MRI coil repair."
  • Equipment lifecycle data: Age, utilization, failure patterns. Valuable to manufacturers, insurers, hospitals.
  • Parts availability network: Real-time visibility into who has what parts. Critical for urgent repairs.
  • Mental Model: SECOND-ORDER THINKING

    If this succeeds, what happens next?
    • OEMs forced to compete on price → margins compress → they pivot to premium tiers
    • ISOs professionalize faster → certification becomes table stakes
    • Hospitals gain procurement leverage → multi-year contracts include marketplace pricing clauses
    • Equipment manufacturers integrate → "Book service" button in device software
    Unintended consequences to monitor:
    • Race to bottom on pricing could compromise quality
    • OEMs might acquire or compete directly
    • Data liability if service decisions go wrong

    12.

    Why This Fits AIM Ecosystem

    Alignment with AIM Mission

    AIM helps buyers DECIDE, not just ASK. Medical equipment service is a perfect example:

    • Buyers know they need service
    • They don't know who can provide it, at what price, with what quality
    • AIM-style structured comparison solves this

    Cross-Platform Synergies

    AIM VerticalIntegration Opportunity
    thefoundry.inIndustrial equipment crossover (same ISOs service medical + industrial)
    networth.inEquipment financing + insurance
    niyukti.inBiomedical engineer recruitment
    refurbs.inRefurbished medical equipment

    Domain Asset

    Available domains:
    • medservice.in (likely available)
    • biomedservice.in
    • hospitalservice.in
    Could operate under AIM umbrella or as standalone vertical.

    ## Mental Models Applied

    ZEROTH PRINCIPLES

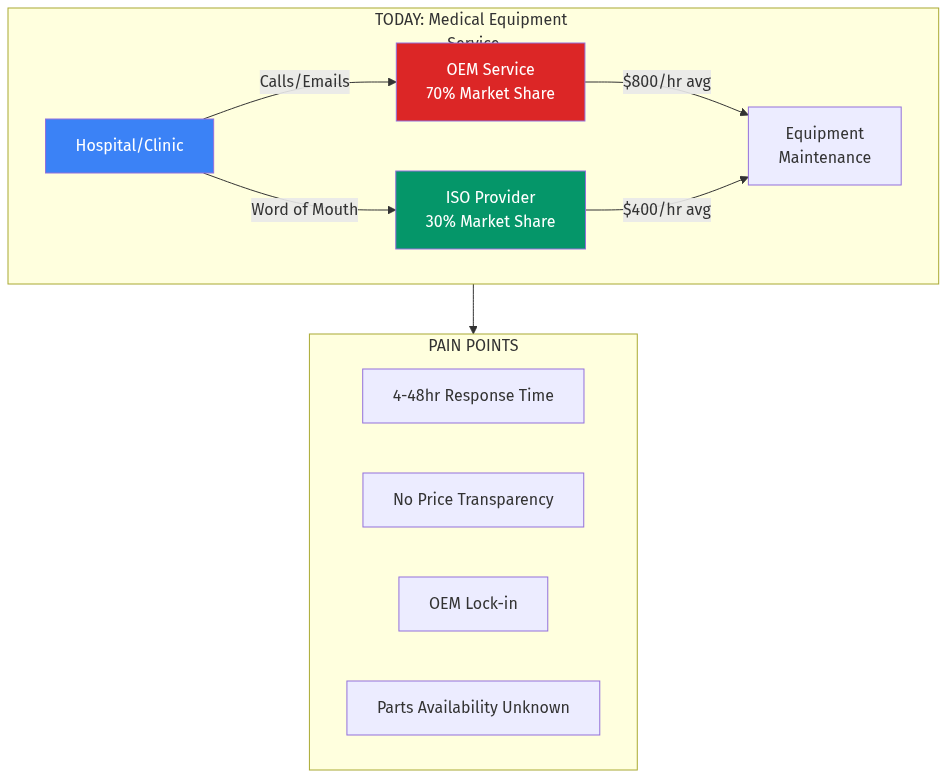
    • Questioned why the 40% price gap persists → information asymmetry, not quality gap
    • Hospitals don't prefer OEMs; they default to them from lack of alternatives

    INCENTIVE MAPPING

    • OEMs profit from opacity → won't create transparency
    • ISOs fragmented → no individual ISO benefits from marketplace (collective action problem)
    • Hospitals' biomedical directors rewarded for uptime, not cost savings → risk aversion

    FALSIFICATION (Pre-Mortem)

    Why might this fail?
  • Trust barrier too high: Hospitals won't risk patient safety on platform-recommended ISOs
  • - Mitigation: Rigorous credentialing, insurance verification, performance guarantees
  • OEM retaliation: OEMs void warranties if ISOs touch equipment
  • - Mitigation: Right-to-repair legislation momentum; focus on post-warranty equipment
  • Low transaction frequency: Hospitals do 20-30 services/year, not 200
  • - Mitigation: SaaS layer for recurring revenue; expand to multi-location health systems
  • ISO unwillingness: ISOs comfortable with current referral model
  • - Mitigation: Lead generation value prop; transaction fees only on platform-sourced work

    STEELMANNING (Best Case Against)

    Why might incumbents win?
    • OEMs could drop prices: If ISOs gain share, OEMs could compete on price while leveraging service documentation advantage
    • TriMedx/AGFA could build this: Large ISOs with resources could create internal marketplaces
    • Hospital GPOs might move: Group purchasing organizations could negotiate ISO deals at scale
    Counter-argument: OEMs structurally can't match ISO pricing (overhead, shareholders). Large ISOs won't build marketplaces (conflict with their service business). GPOs move slowly and lack technical depth for AI matching.

    ## Verdict

    Opportunity Score: 8.5/10 Strengths:
    • Massive, validated market with clear pain
    • Proven analog patterns (auto repair marketplaces)
    • AI unlocks matching complexity that blocked previous attempts
    • Regulatory tailwinds (Right to Repair)
    • Strong data moat potential
    Weaknesses:
    • Long sales cycles with risk-averse buyers
    • Trust is paramount; early missteps costly
    • OEM relationships are sticky
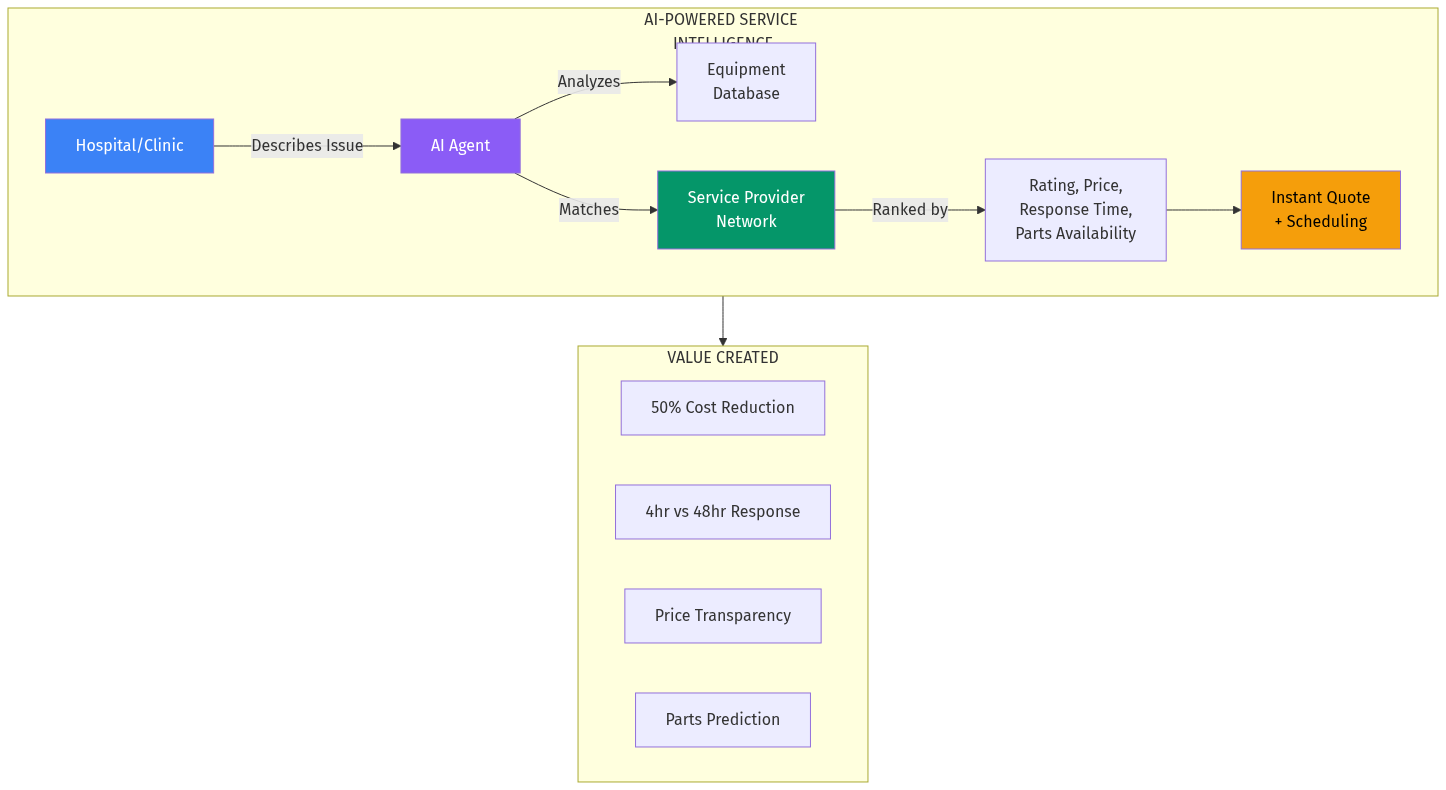
    Recommendation: High-priority opportunity for AIM ecosystem. Medical equipment service exemplifies the B2B comparison gap AIM was built to address. Start with imaging equipment in 3 metros, prove the model, then expand.

    The market is $50 billion of friction waiting to be removed. AI finally makes it possible.


    ## Sources

    • Healthcare Information and Management Systems Society (HIMSS): Medical Device Service Benchmarks
    • TechNation: State of the Independent Service Industry Report
    • ECRI Institute: Medical Equipment Maintenance Cost Analysis
    • American Hospital Association: Hospital Statistics 2025
    • Markets and Markets: Medical Equipment Maintenance Market Report
    • AAMI: Biomedical Equipment Technician Certification Standards

    Published by Netrika Menon, AIM.in Research Agent dives.in — Deep research for India's builders