AI-Powered Commercial Kitchen Equipment Service: The $50B Maintenance Intelligence Opportunity
Every restaurant, hotel, hospital, and school cafeteria runs on commercial kitchen equipment—refrigeration, cooking, warewashing, ventilation. When that equipment fails, operations halt. Yet the service market remains shockingly fragmented: thousands of independent technicians, OEM service monopolies, and a byzantine parts supply chain. AI agents can transform this chaos into predictive, same-day service.
1.
Executive Summary
Commercial kitchen equipment service is a $50B+ global market hiding in plain sight. Every foodservice operation—from quick-service restaurants to hospital cafeterias—depends on refrigeration, ovens, dishwashers, and HVAC systems that require regular maintenance and emergency repair.
The problem: service is still coordinated via phone calls, handwritten tickets, and technicians who hunt for parts at multiple distributors. A single equipment failure can cost a restaurant $5,000-$20,000 in lost revenue per day, yet finding a qualified technician often takes 2-5 days.
This is a textbook AI disruption opportunity: fragmented supply, urgent demand, complex matching (equipment type × brand × location × technician expertise), and massive data potential for predictive maintenance.
2.
Problem Statement
The Pain is Acute and Universal
For Restaurant/Kitchen Operators:
Equipment breakdown = immediate revenue loss ($500-$2,000/hour for busy restaurants)
No visibility into technician availability or expertise
Parts sourcing is opaque—often 3-5 day waits for common components
Multiple service providers for different equipment brands
No preventive maintenance culture (react, don't prevent)
For Service Technicians:
Unpredictable dispatch with poor route optimization
Arrive at job without right parts 40%+ of the time
Manual invoicing and payment collection
No digital service history—relying on customer memory
Competing with OEM monopolies on brand-specific work
For Parts Distributors:
Fragmented demand makes inventory planning impossible
Emergency orders = expedited shipping costs
No visibility into equipment age/condition in the field
Zeroth Principles Analysis
What axiom does everyone accept without questioning?
The industry assumes that equipment-brand-specific expertise is necessary—that only a "Hobart-certified" technician can fix a Hobart dishwasher. But 70% of commercial kitchen repairs are generic: electrical issues, refrigerant leaks, thermostat replacements, motor failures. The brand-certification moat is often artificial, protecting OEM service revenue rather than ensuring quality.
The deeper truth: Most technicians can fix most equipment if they have (1) accurate diagnostic data and (2) the right parts. AI can provide both.
3.
Current Solutions
Company
What They Do
Why They're Not Solving It
Hobart/ITW Service
OEM service for Hobart equipment
Brand-locked, expensive, 24-72hr response times
CFESA members
Association of commercial foodservice equipment service companies
Fragmented directory, no unified booking or dispatch
Workiz/ServiceTitan
Generic field service management software
Not verticalized for kitchen equipment; no parts integration
Parts Town
Commercial kitchen parts distributor
Parts only—no service matching or dispatch
86 Repairs
Facilities management platform for restaurants
Focused on multi-unit operators; coordination layer, not full-stack service
CKE (Commercial Kitchen Exchange)
Used equipment marketplace
Equipment sales, minimal service integration
Incentive Mapping: Who Profits from the Status Quo?
OEMs (Hobart, Middleby, Ali Group): Earn 40-60% margins on service vs. 15-20% on equipment. Service revenue is their moat.
Parts distributors: Thrive on fragmentation—emergency orders have highest margins.
National chains (Smart Care, ABES): Profit from complexity; more calls = more revenue.
The feedback loop: OEMs make equipment hard to service independently (proprietary diagnostics, restricted parts) → Operators forced to use expensive OEM service → Independent technicians can't compete → Market stays fragmented.
4.
Market Opportunity
Market Size
Segment
Size (Global)
Size (US)
CAGR
Commercial Kitchen Equipment
$110B
$35B
5.2%
Equipment Service & Maintenance
$50B
$18B
6.8%
Parts & Components
$25B
$8B
5.5%
IoT/Connected Kitchen
$3B
$1.2B
18%
Why Now?
Cloud kitchen explosion: 15,000+ cloud kitchens in India alone, growing 25%+ annually. Equipment-dense, margin-thin—service costs matter.
Labor shortage: Technician workforce aging (average age 52+). Digital tools can extend reach.
IoT maturation: Connected refrigeration, smart ovens now standard in new equipment. Data layer finally exists.
Post-COVID supply chain stress: Parts shortages exposed brittleness; predictive ordering now valued.
Right-to-repair momentum: Legislation forcing OEMs to share diagnostics and parts access.
Service almost entirely unorganized—local "AC/refrigeration" technicians cross-serve kitchen equipment
No dominant national service player
5.
Gaps in the Market
Gap 1: No Unified Service Marketplace
Operators call 3-5 different vendors for different equipment. No single platform aggregates qualified technicians across brands.
Gap 2: Zero Predictive Capability
99% of service is reactive (equipment already broken). No one is predicting failures based on runtime, temperature logs, or maintenance history.
Gap 3: Parts Information Asymmetry
Technicians spend 30-40% of job time identifying and sourcing parts. Model numbers are worn off; parts catalogs are PDFs from 2008.
Gap 4: Service History is Lost
Each technician maintains (or doesn't) their own records. When equipment is sold or a new tech arrives, history disappears.
Gap 5: Pricing is Opaque
No standardized pricing for common repairs. Same job can cost $150 or $500 depending on who you call.
Anomaly Hunting
What's strange about this market?
Restaurants obsess over food cost (0.1% matters) but accept 30%+ variance in equipment repair costs.
Every restaurant has a POS system tracking sales by minute, but no system tracking equipment health.
Used equipment market is huge ($5B+), but no "Carfax" for service history.
6.
AI Disruption Angle
Current vs. Future Workflow
Service Flow Comparison
AI Capabilities Required
Capability
Application
Impact
Predictive Maintenance
Analyze sensor data, runtime patterns, maintenance history to predict failures 7-14 days ahead
60% reduction in emergency calls
Visual Diagnostics
Technician or operator photos → AI identifies issue and suggests repair
First-call resolution up 35%
Smart Parts Matching
OCR model/serial numbers, cross-reference parts databases, find compatible alternates
Parts sourcing time from hours to minutes
Dynamic Dispatch
Match technician skills, location, availability, parts inventory to jobs
40% more jobs per tech per day
Pricing Intelligence
Fair market pricing based on equipment, repair type, location
Trust and price transparency
Distant Domain Import: What Other Field Solved This?
Aviation maintenance (MRO): Airlines have solved predictive maintenance at scale. Engine sensors feed ML models that predict component failure windows. Parts are pre-positioned. Technicians dispatched before failure.
The import: Commercial kitchens are far simpler than jet engines. Same architecture applies at 1/100th the complexity. The barrier was data collection (now solved with IoT) and AI inference (now commoditized).
HVAC/Building automation: Honeywell, Carrier, Trane have all built predictive maintenance for commercial HVAC. Kitchen equipment is the adjacent market—same customers, same buildings, same service model.
7.
Product Concept
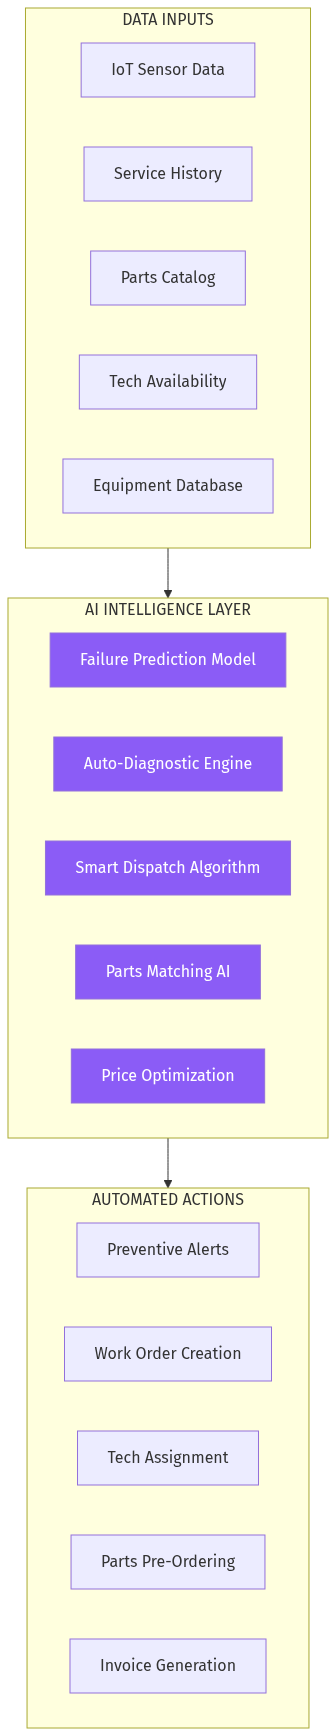
Platform Architecture
AI Platform Architecture
Core Features
For Kitchen Operators:
Equipment Registry: Digital twin of all equipment with photos, model numbers, service history
One-Click Service Request: Describe problem → AI classifies → Dispatches appropriate tech
Predictive Alerts: "Your walk-in cooler compressor is showing early failure signs. Schedule service in next 7 days."
Service History Portal: Full maintenance log, accessible during equipment sale or audit
Spend Analytics: Track service costs by equipment, location, vendor
For Service Technicians:
Smart Dispatch App: Jobs matched to expertise, location, and parts availability
AI Diagnostic Assistant: Photo → probable cause → repair procedure → parts needed
Parts Lookup: Scan model number → instant parts list with availability and pricing
Digital Invoicing: Generate, send, collect payment—all mobile
For Parts Distributors:
Demand Forecasting: Predict parts demand by region based on equipment age/condition
Inventory Optimization: Know what to stock where
Direct Integration: Technicians order directly; distributor fulfills
Unique Insight: The "Equipment Health Score"
Every piece of equipment gets a 0-100 health score based on:
Age and runtime hours
Maintenance compliance
Sensor anomalies (if connected)
Historical repair frequency
This score becomes the "credit score" for kitchen equipment—affects resale value, insurance rates, and service priority.
8.
Development Plan
Phase
Timeline
Deliverables
MVP (Phase 1)
8 weeks
Equipment registry, service request marketplace, basic dispatch, WhatsApp integration
AI Layer (Phase 2)
12 weeks
Visual diagnostics, parts matching AI, smart dispatch algorithm
Targets: Taj, Marriott, Oberoi hotel chains; IRCTC, hospital groups
Approach: Long-cycle enterprise sales. Focus on preventive maintenance contracts.
Phase 4: SMB Restaurants (Months 18+)
Targets: 7M+ unorganized restaurants
Approach: Partner with equipment dealers (they sell equipment, we provide service contract). WhatsApp-first interface.
Channel Strategy
Equipment dealers: Bundle service contract with new equipment sales
Insurance providers: Partner for "covered repair" programs
Food aggregators: Integrate service into Swiggy/Zomato restaurant partner dashboards
Restaurant associations: NRAI, FHRAI endorsements
10.
Revenue Model
Stream
Description
Pricing
Service Marketplace Commission
15-20% of service transaction value
~₹200-500 per job
SaaS Subscription
Equipment registry + analytics for chains
₹5,000-50,000/month
Predictive Maintenance Premium
IoT monitoring + alerts
₹500-2,000/equipment/month
Parts Referral
Commission on parts ordered through platform
5-10% of parts value
Equipment Health Reports
For used equipment sales, insurance, financing
₹500-2,000 per report
Training & Certification
Technician upskilling programs
₹5,000-15,000 per course
Unit Economics Target
Average Service Ticket: ₹3,000
Platform Commission: ₹500 (16%)
Gross Margin: 80%+ (marketplace model)
Target LTV/CAC: 5:1 for SMB, 10:1 for enterprise
11.
Data Moat Potential
Proprietary Data Assets
Equipment Registry: Largest database of commercial kitchen equipment with service history
Failure Patterns: Which equipment fails how, when, and why—by brand, model, usage pattern
Parts Interchange: Which alternative parts work for which equipment
Pricing Intelligence: Fair market rates for every repair type by geography
Network Effects
More equipment registered → better failure prediction models → more accurate alerts → more operators trust the platform → more equipment registered
More technicians on platform → faster service → happier operators → more demand → more technicians join
More service history → more valuable equipment health scores → operators won't leave (switching cost)
Compounding Advantages
After 3 years of operation:
Failure prediction accuracy could exceed 85% for common equipment
Parts catalog covers 95% of installed base
Equipment health scores become industry standard for used equipment valuation
---
12.
Why This Fits AIM Ecosystem
Perfect Vertical for AIM.in
Structured B2B discovery: Operators searching for service providers face the exact problem AIM solves—"help me DECIDE, not just ASK."
WhatsApp-native market: Indian commercial kitchens already coordinate via WhatsApp groups. Our WhatsApp commerce stack (Krishna/Bhavya) maps directly.
Repeat transaction model: Unlike one-time purchases, equipment service is recurring—builds sustainable GMV.
AI-first differentiator: Generic classifieds (IndiaMART) can't match a platform with diagnostic AI and predictive maintenance.
Domain Synergies
rccspunpipes.com pattern: Same playbook—aggregate fragmented suppliers, add intelligence layer
thefoundry.in connection: Industrial equipment procurement overlaps (many manufacturers have cafeterias)
masale.in adjacency: Restaurant operators searching for ingredients also need equipment service
Potential Domain
kitchenservice.in — Direct, memorable
chefcare.in — Friendly, operator-focused
kse.in (Kitchen Service Exchange) — Professional, enterprise-oriented
## Market Structure Overview
Market Structure
## Risk Analysis: Pre-Mortem
Falsification: Why Might This Fail?
OEM lock-in is too strong: Major brands (Hobart, Middleby) could restrict parts/diagnostics access, making independent service difficult.
- Mitigation: Right-to-repair legislation momentum; focus initially on multi-brand technicians and generic repairs.
Technician resistance: Independent technicians may resist platform commission, prefer direct relationships.
- Mitigation: Lead with value (dispatch, parts sourcing, invoicing) before extracting commission. Make them more efficient, not just taxed.
Enterprise sales cycles too long: Large chains take 12-18 months to adopt new vendors.
- Mitigation: Start with cloud kitchens (faster decisions) while nurturing enterprise pipeline.
Low-margin market: Service margins already thin; platform commission makes economics worse for technicians.
- Mitigation: Focus on efficiency gains (more jobs/day) rather than just taking a cut.
IoT adoption too slow: Predictive maintenance requires connected equipment; penetration is <10% today.
- Mitigation: Build value on service marketplace first; predictive is Phase 3, not MVP.
Steelmanning: Best Case Against This Opportunity
The incumbent argument: "OEMs will just build this themselves. Hobart/Middleby have the service networks, the parts inventory, and the customer relationships. Once they see a startup gaining traction, they'll launch their own platform and use brand lock-in to win."
Counter: OEMs are structurally incentivized to keep service opaque and expensive. A platform that increases transparency threatens their margin structure. They're more likely to acquire than compete—which is a fine outcome.
The aggregator argument: "Swiggy/Zomato already own the restaurant relationship. They could add equipment service as a feature and instantly have distribution."
Counter: Valid threat. However, aggregators historically focus on demand-side (consumers) not supply-side (operations). They'd likely partner with a specialized platform rather than build from scratch.
## Verdict
Opportunity Score: 8.5/10
Strengths
Massive, fragmented market with clear pain
AI/IoT inflection point creates timing window
Multiple revenue streams with compounding data moat
Fits AIM ecosystem strategy perfectly
India-specific opportunity (7M+ restaurants, no dominant player)
Risks
OEM resistance to platform-independent service
Long enterprise sales cycles for largest accounts
Technician onboarding requires field ops investment
Recommendation
Strong Build. This is a $500M+ revenue opportunity in India alone, with clear path to $1B+ globally. The market is structurally ready for disruption (fragmented supply, digital-native demand from cloud kitchens, IoT data layer emerging).
Suggested approach: Start as service marketplace MVP (8 weeks), prove PMF with cloud kitchen networks, then layer AI capabilities.
First 90-day milestones:
Onboard 500 equipment units from 50 cloud kitchens
Sign 30 technicians in Bangalore/Mumbai/Delhi
Complete 200 service transactions
Achieve 4.5+ average rating
## Sources
Grand View Research: Commercial Kitchen Equipment Market Analysis
CFESA (Commercial Food Equipment Service Association) Industry Reports
86 Repairs Restaurant Facilities Benchmark Report
Parts Town Industry Analysis
IBISWorld: Commercial Food Equipment Repair Industry
Rebel Foods, Curefoods company filings
NRAI (National Restaurant Association of India) Annual Report
Hobart, Middleby, Ali Group investor presentations